Discover more
.webp)
indicatorsSee how investments through Goparity are tracking over time, with clear figures on amounts financed, returns, incidentes and key indicators.
Projects funded through loans

Lent to sustainable projects
€

Paid back principal
€
Interest paid
€
Traded in marketplace
€
The total amount lent to all projects financed through Goparity, broken down per risk rating and project category.
So far, we have funded 0 projects. From these, 0 have successfully reached their payments plan maturity - all investors have received their entire capital invested and interest.
General indicators at the end of the year. All values were rounded to the unit (no decimals).
The sum of the amount lent to all funded projects during the reference year.
The number of all funded projects in the reference date.
Average amount lent per project. It is calculated as follows: the amount lent divided by the number of funded projects.
Sum of borrowed principal that has already been paid back by the borrowers (promoters) to the lenders (investors).
Share of borrowed principal that has already been paid back to the lenders
The sum of total gross interest paid by the borrowers (promoters) to the lenders (investors).
Average annual interest rate weighted per crowdlending amount of all funded projects.
Average loan term weighted per crowdlending amount of all the funded projects. When a loan has been restructured, the term considered here, takes into account its initial term.
Non-cumulative and historic overview, showcasing the number of loans in default at the end of each year, and at the end of the quarter in the current year.
Default Performance Report for purposes of the ECSP Regulation 2023-2025
Number of non-defaulted loans observed at the beginning of the 12-month observation window.
All loans considered in the denominator that had at least onedefault event during the 12-month observation window.
The simple average of the observed defaulted loans over the total non-defaulted loans.
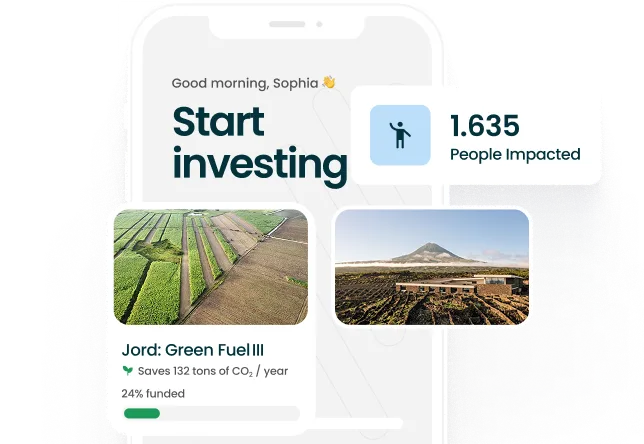
See how your investments help build a more sustainable and inclusive economy.

Learn how to start investing in sustainable projects.
.svg)

.svg)

.svg)

.svg)
.svg)
.svg)
.svg)